My Data Visualisation Blog
DataViz Makeover 3
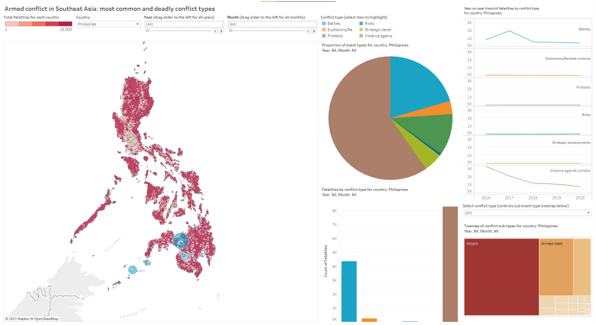
This dashboard surfaces the most common and deadliest armed conflicts in Southeast Asia, from 2010 to 2020.</br></br>Visit the dashboard [here](https://public.tableau.com/profile/andywong#!/vizhome/DataVizMakeover3ArmedconflictinSoutheastAsia/GeolocationofarmedconflictinSoutheastAsia). {width=100%}
DataViz Makeover 2
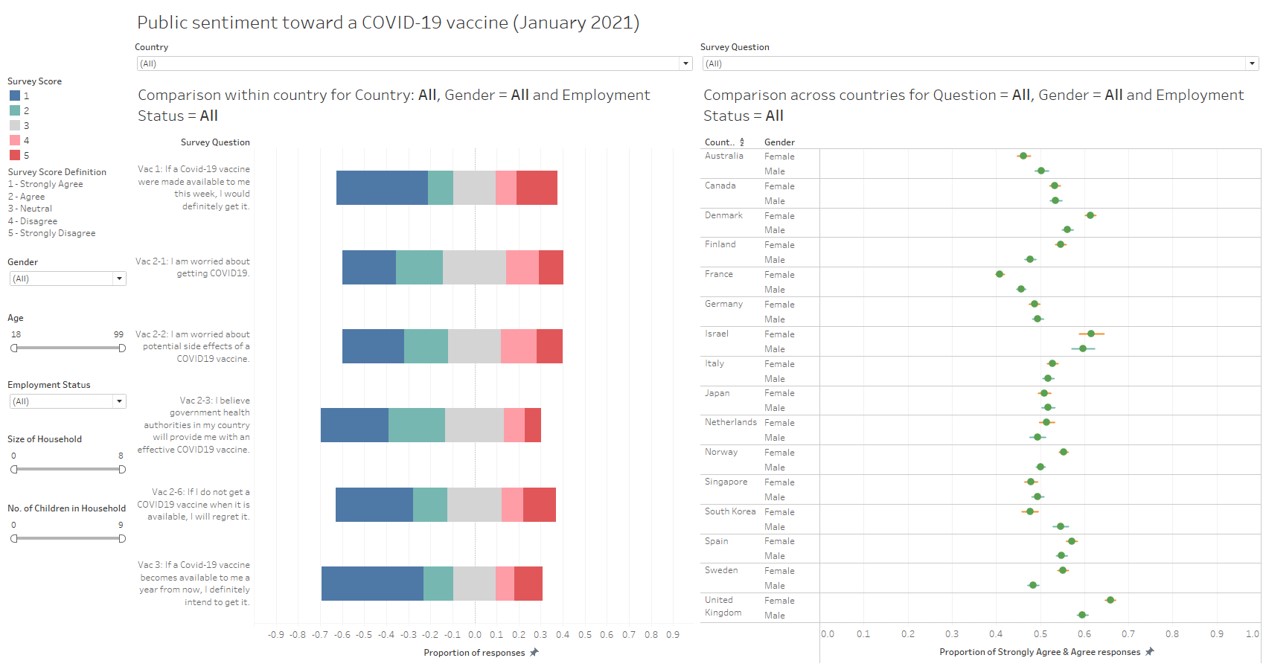
This visualisation presents public sentiment towards a COVID-19 vaccine.
DataViz Makeover 1
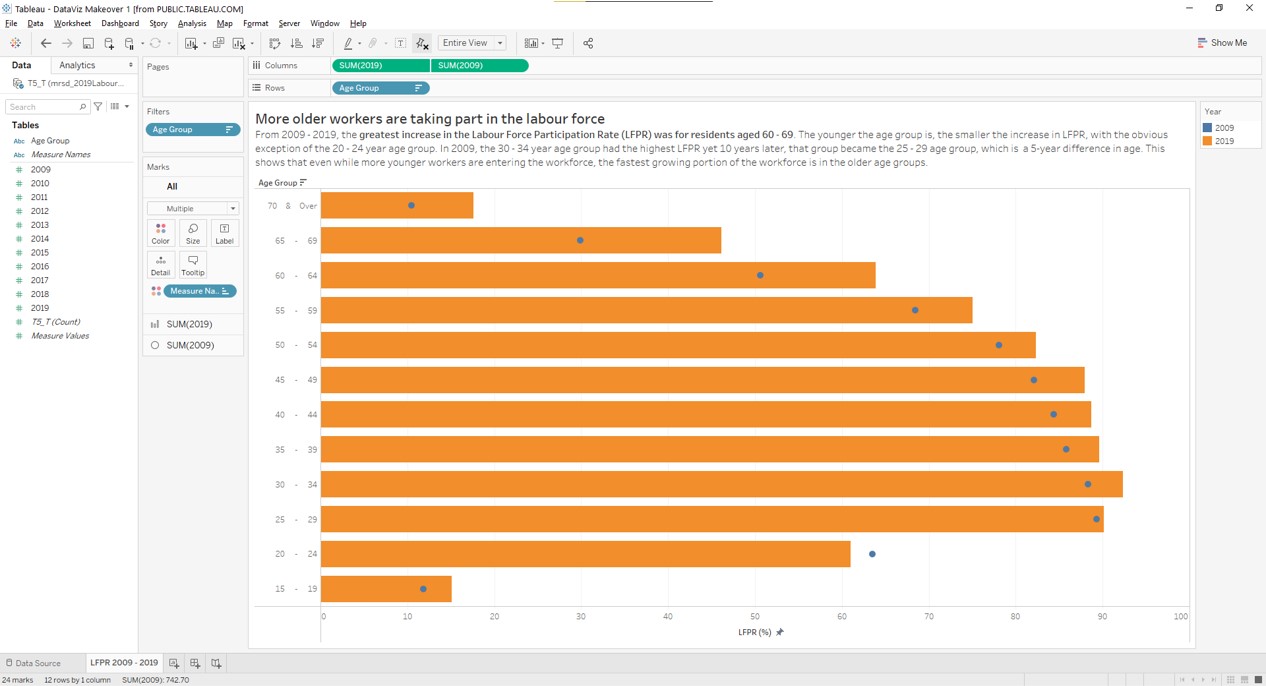
This visualisation presents the growth of Singapore's Labour Force Participation Rate (LFPR) from 2009 to 2019.
Welcome to NetlifyBlog
Welcome to our new blog, NetlifyBlog. We hope you enjoy reading what we have to say!